The Visible Fraction
The largest fjord system on Earth was cut by one kind of water and filled by another. One of them holds most of the planet's fresh water; the other holds almost none of it. And much of the water people actually depend on is in neither of those visible reservoirs.
The largest thing water has made
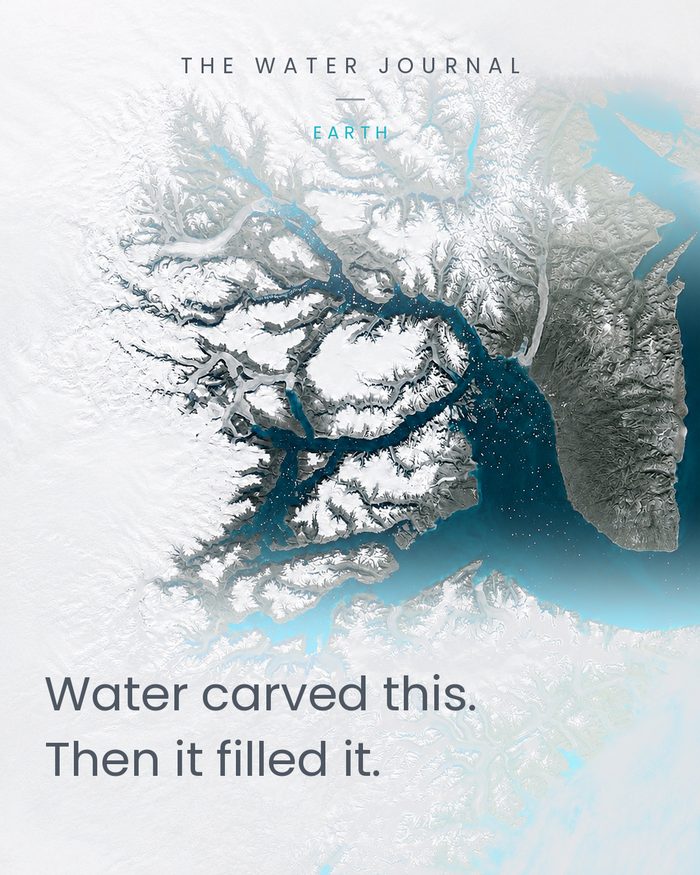
Scoresby Sund — Kangertittivaq — opens into the Greenland Sea on the east coast, about 70° north. Its main inlet runs some 110 kilometres inland and then branches, and the branches keep branching, until the longest of them reaches 340 to 350 kilometres from the coast. It is generally described as the largest fjord system in the world. A peer-reviewed survey of the system puts its area at 13,700 square kilometres; popular sources quote figures several times larger, depending on where the boundary is drawn.
A river may begin a valley. A glacier transforms it. A river erodes down towards the level of the sea it drains into, and below that level there is little downhill left to work with. Flowing ice is not constrained in the same way: under gravity it deforms and slides, and it can erode and overdeepen its bed far below sea level.
In East Greenland the ice did not carve from nothing. Glaciers inherited an older landscape — valleys and structural weaknesses in the bedrock that long predate the late Cenozoic ice sheets — then widened, deepened and reshaped it into the system seen today. Bathymetric and acoustic survey of inner Scoresby Sund finds bedrock basins deeper than 1,500 metres. That figure is a measure of how far below sea level moving ice was willing to work.
As the glaciers retreated, the sea flooded the overdeepened valleys they left behind. What the satellite photographs is a trench cut by fresh water in its solid state, flooded by salt water in its liquid one. Two forms of water, working in sequence across vastly different timescales.
The inventory
Take all the water on the planet and almost all of it is salt. Something like 2.5% is fresh. Then take that fresh fraction and sort it. Just over 68% is ice: glaciers, ice caps, ice sheets, most of it in Antarctica and Greenland. About 30% is underground. Roughly 1.2% is everything else — surface water, soil moisture, permafrost, swamps, the atmosphere, every living thing.
Rivers, taken together, hold on the order of two thousand cubic kilometres at any one moment; the first gauge-corrected global accounting, published in 2024, puts the mean at 2,246 cubic kilometres. Against the planetary total that is around one ten-thousandth of one per cent.
The two waters in the photograph — the ice sheet at the head of the fjord, the sea at its mouth — are the two largest reservoirs on Earth. The rivers that everyone pictures when they picture fresh water are not in the same class of number.
What is actually drunk
Ice is the largest freshwater store, but storage is not the same thing as supply. Most of that frozen inventory is not directly available to a water system.
Set the ice aside and the picture inverts. Of the fresh water on Earth that is actually liquid, the UN World Water Development Report puts groundwater at approximately 99%. It is the resource, and it is the one nobody looks at.
The report is careful about what that means in use, and it is worth being equally careful. Groundwater provides half of the volume of water withdrawn worldwide for domestic use — drinking, cooking, washing, sanitation, all of it together — and it is the drinking water of the large majority of rural populations who have no piped supply. It also accounts for around a quarter of all water withdrawn for irrigation, serving 38% of the world's irrigated land.
So: not half the world's drinking water exactly, but half of everything domestic, and the food supply of a large part of the planet on top of that. The precise claim is less quotable than the loose one and considerably more alarming.
The water we photograph and the water we depend on are often not the same water.
A stock is not a flow
One correction has to be made here, because the river number invites a wrong conclusion.
Two thousand cubic kilometres sounds like nothing, and as a standing quantity it is. But rivers are not a reservoir; they are a conveyor. At global scale the ratio of river storage to annual river flow is measured in weeks, not years: roughly 2,246 cubic kilometres held at any moment against some 37,400 cubic kilometres of continental flow each year. What a river system delivers over a year is vastly larger than what it contains on any given afternoon.
An aquifer is the opposite case. It holds an enormous quantity and moves it very slowly — water in deep groundwater can be thousands of years old, and in the driest places it is not being replaced on any timescale that matters to the people pumping it. A large store with a slow refill behaves, under heavy withdrawal, like a finite one.
This is why the inventory alone does not tell you what is available. The visible water is small but fast. The invisible water is vast but slow. Both of those facts are constraints, and they are different constraints.
Back to the fjord
Which returns the photograph to its proper reading.
Scoresby Sund is one of the few places where all three parts of this water story meet in a single frame: the ice sheet inland, meltwater crossing the landscape, and the sea filling the fjord. The branching geometry is a record of ice following — and then amplifying — an older landscape: a map in negative of bedrock structure, inherited valleys and repeated glacial erosion.
It is also, on any human timescale, a still photograph of something moving. The ice is still moving. Meltwater is still crossing the landscape. The sea it drains into is where that fresh water eventually goes and stops being fresh.
Water carved this, then filled it. Neither process belongs only to the past — the fjord remains one of the pathways by which ice and meltwater from the Greenland Ice Sheet reach the sea.
Sources and notes
01 — The fjord
C. Ó Cofaigh, J. A. Dowdeswell and H. Grobe, "Holocene glacimarine sedimentation, inner Scoresby Sund, East Greenland: the influence of fast-flowing ice-sheet outlet glaciers," Marine Geology, vol. 175, nos. 1–4 (2001), pp. 103–129. — largest fjord system in the world, area 13,700 km²; bedrock basins deeper than 1,500 m in the inner fjords.
D. A. Swift, C. Persano, F. M. Stuart, K. Gallagher and A. Whitham, "A reassessment of the role of ice sheet glaciation in the long-term evolution of the East Greenland fjord region," Geomorphology, vol. 97, nos. 1–2 (2008). — glacial modification of a pre-existing landscape; first-order control by topography, bedrock geology and lithological strength.
V. K. Pedersen, N. K. Larsen and D. L. Egholm, "The timing of fjord formation and early glaciations in North and Northeast Greenland," Geology, vol. 47, no. 7 (2019), pp. 682–686. — incision histories of the East Greenland fjords.
02 — The inventory
U.S. Geological Survey, Water Science School, "Where is Earth's Water?" — freshwater distribution: 68.7% glaciers and ice caps, 30.1% groundwater, 1.2% surface and other.
UNESCO / UN-Water, The United Nations World Water Development Report 2022: Groundwater — Making the Invisible Visible. — groundwater approximately 99% of liquid fresh water; half the volume withdrawn for domestic use; around 25% of irrigation withdrawals, serving 38% of irrigated land.
U.S. Geological Survey, "Groundwater Age." — groundwater can be thousands of years old where recharge rates are low, where the aquifer is very thick, or where aquifers are separated by confining units.
E. L. Collins et al., "Global patterns in river water storage dependent on residence time," Nature Geoscience, vol. 17 (2024). — global river storage 2,246 ± 505 km³; continental flow 37,411 ± 7,816 km³ per year.
Note on evidence
Published areas for Scoresby Sund differ by a factor of nearly three, depending on whether only the fjord waters or the surrounding branching region is counted. The peer-reviewed figure of 13,700 km² is used here; widely quoted figures near 38,000 km² come from sources that do not define the boundary.
The storage-to-flow ratio quoted for rivers is a residence-time scale, not a statement that every molecule is replaced within it.
Depths are reported from bathymetric and acoustic survey of the inner fjords; encyclopedic sources quote a maximum of about 1,450 m for the system as a whole.
Cover image: NASA Terra (MODIS), Scoresby Sund, East Greenland.